InTowards Data SciencebySamir Saci4 Smart Visualizations for Supply Chain Descriptive AnalyticsDiscover how to improve your supply chain descriptive analytics with 4 smart visualizationsNov 3, 20221Nov 3, 20221
InTowards Data SciencebySamir SaciWhat is Data Quality?Discover Methodologies to Ensure Accuracy, Consistency and Completeness of Supply Chain DataAug 15, 20231Aug 15, 20231
InTowards Data SciencebySamir SaciRoad Transportation Network Visualization with PythonBuild Visualizations of your FTL Network Performance: deliveries/route, cost per ton and trucks sizeSep 9, 2020Sep 9, 2020
InTowards Data SciencebySamir SaciBuild Interactive Charts using Flask and D3.jsDesign interactive D3.js visualizations for E-Commerce Sales Analytics and Support Business DecisionsMay 4, 2021May 4, 2021
InTowards Data SciencebySamir SaciSupply Chain Sustainability Reporting with PythonBuild a sustainability report focusing on the CO2 emissions of your distribution network using Python.Dec 3, 20215Dec 3, 20215
InTowards Data SciencebySamir SaciDeploy Logistics Operational Dashboards using DataPaneDeploy Reporting Solutions using DataPane to Support Warehousing Logistics Operations for E-CommerceJan 21, 2022Jan 21, 2022
InTowards Data SciencebySamir SaciExcel Automation Tools for User-Friendly Reports with XlsxWriterAutomate excel report creation with python by writing explicit excel formulas that any Excel user can read.Aug 16, 20222Aug 16, 20222
InTowards Data SciencebySamir SaciAnimate your Python Graphs with PillowCreate animated gifs of your plots with the Python library Pillow to bring life to your insights.Aug 31, 20221Aug 31, 20221
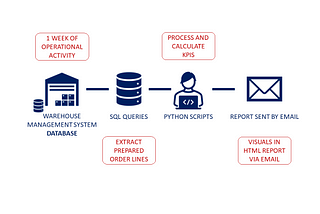
InTowards Data SciencebySamir SaciAutomate Operational Reports Distribution in HTML Emails using PythonAutomate the distribution of supply chain operational reports with visuals built in HTML emails with Python.Sep 7, 20221Sep 7, 20221