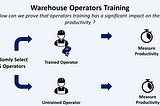
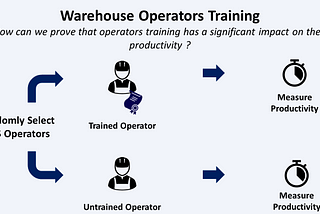
InTDS ArchivebySamir SaciLean Six Sigma with Python — Kruskal Wallis TestUse the Kruskal Wallis Test in Lean Six Sigma with Python to evaluate the impact of training on warehouse productivity.Aug 9, 2021Aug 9, 2021
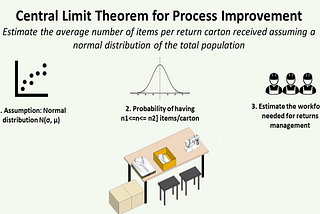
InTDS ArchivebySamir SaciCentral Limit Theorem for Process Improvement with PythonEstimate the workload for returns management assuming a normal distribution of the number of items per carton received from your stores.Aug 24, 2021Aug 24, 2021
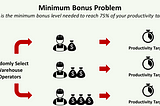
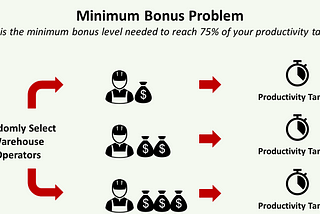
InTDS ArchivebySamir SaciLean Six Sigma with Python — Logistic RegressionPerform a Logistic Regression to estimate the minimum bonus needed to reach 75% of a productivity target.Aug 31, 2021Aug 31, 2021
InTDS ArchivebySamir SaciStatistical Sampling for Process Improvement using PythonUse sample data to estimate the average lead time for processing customer orders in a customer service department.Sep 28, 20212Sep 28, 20212
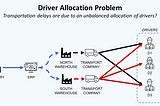
Samir SaciLean Six Sigma with Python — Chi-Squared TestPerform a Chi-Squared Test to explain a shortage of drivers impacting your transportation networkOct 30, 2021Oct 30, 2021


![A visual representation of order processing lead time estimation using statistical sampling with Python. The left shows the population of customer service representatives, represented by icons, with a distribution (σ, μ). The right displays a sample of the population used to estimate the average lead time, with a 90% confidence interval (x̄ ∈ [μ-b, μ+b]). The image explains how sample data is used to infer the overall lead time for processing customer orders in a customer service department.](https://miro.medium.com/v2/resize:fill:160:106/1*Yo8D0L6Fzcgz_bsOtO15NA.png)
![A visual representation of order processing lead time estimation using statistical sampling with Python. The left shows the population of customer service representatives, represented by icons, with a distribution (σ, μ). The right displays a sample of the population used to estimate the average lead time, with a 90% confidence interval (x̄ ∈ [μ-b, μ+b]). The image explains how sample data is used to infer the overall lead time for processing customer orders in a customer service department.](https://miro.medium.com/v2/resize:fill:320:214/1*Yo8D0L6Fzcgz_bsOtO15NA.png)